Extract Tab
The Extract tab handles all image preparation and processing steps before visualization and analysis. It is organized into four sub-tabs: Transform, Alignment, Segmentation, and Quantification.
Transform
The Transform sub-tab provides tools for basic image manipulation and multi-cycle image registration.
Crop
Select a rectangular region to keep from the current image:
Image Selection Tool: Click the image icon to draw a crop region on the canvas.
Clear Selection: Click the X icon to discard the current selection.
Rotate
Adjust the rotation angle using the slider, then click Ok to apply.
Flip
Mirror the image along either axis:
Flip Horizontal: Mirror the image left-to-right.
Flip Vertical: Mirror the image top-to-bottom.
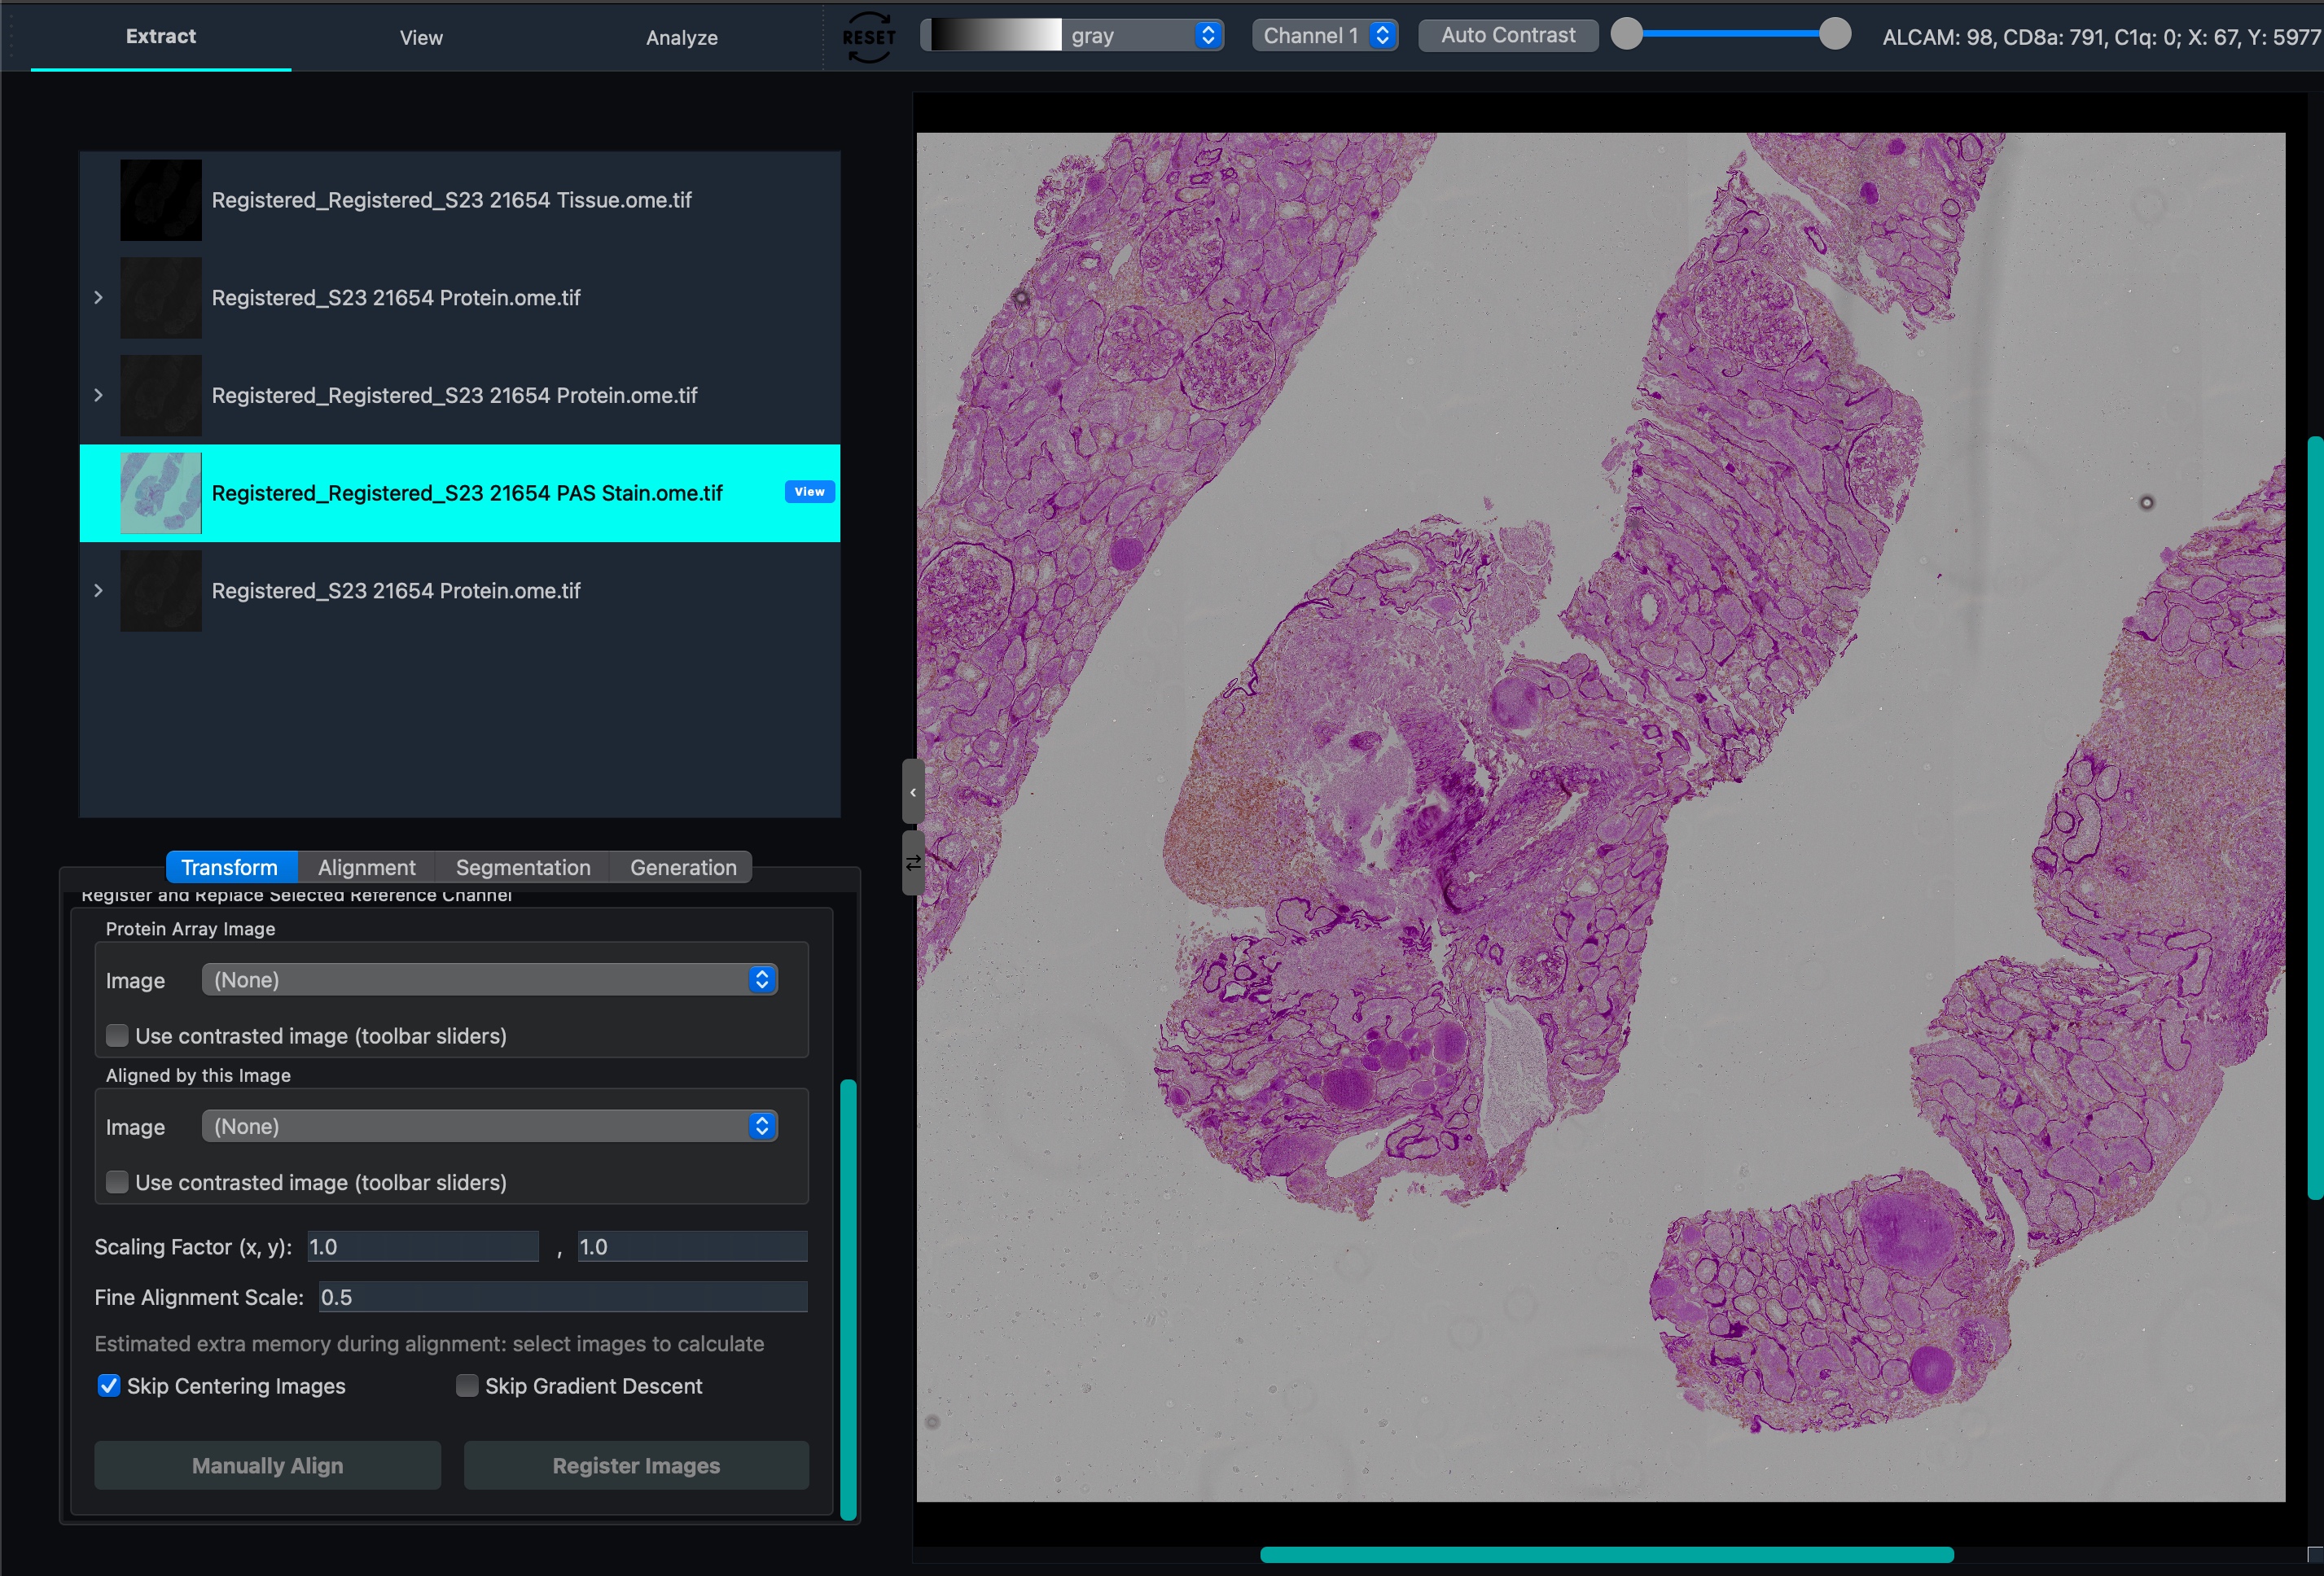
Registeration (and replace)
Register a channel from an image onto a channel from another image. Optionally replace the channel from the other image with the newly registered channel. This can be done automatically, but manually centering and roughly aligning the channels before automatic registeration is strongly encouraged for best results.
Parameters:
Parameter |
Default |
Description |
|---|---|---|
Scaling Factor X |
1.0 |
Horizontal scale correction for pixel size differences between images. Set to the ratio of pixel sizes if the source and target images were acquired at different resolutions. |
Scaling Factor Y |
1.0 |
Vertical scale correction. Adjust independently of X if pixel aspect ratio differs between acquisitions. |
Fine Alignment Scale |
0.5 |
Resolution factor for the fine-tuning alignment pass. Lower values downsample more aggressively for speed; increase toward 1.0 for higher precision on well-initialized images. |
Skip Centering Images |
On |
When enabled, skips the centering pre-step in ITK coarse alignment. Disable if images are severely off-center. |
Skip Gradient Descent |
Off |
When enabled, skips the ITK gradient descent step entirely, using only the initial coarse and fine alignment. Enable to speed up alignment when the images are already roughly aligned. |
Use Contrasted Image |
Off |
Use the canvas contrast-adjusted version of the image for alignment instead of the raw image. This also effects manual registeration modal. |
After automatic registration completes, a manual-registration modal displays the result. You can manually fine-tune the output in this modal before confirming.
Manual-registration modal — advanced settings
The post-registration modal provides landmark-based manual refinement via RANSAC affine correction.
Parameter |
Default |
Description |
|---|---|---|
RANSAC Threshold (px) |
10.0 |
Essentially how unsure you are of the landmarks, higher=more uncertainly or more specifically, it controls inlier threshold in pixels for the landmark RANSAC affine computation. Lower values apply stricter outlier rejection (only landmarks that fit the affine model within this many pixels are kept). Increase if too few landmarks are being accepted; decrease for more precise fits. |
Bright Field Alignment
The Alignment sub-tab aligns the brightfield (transmitted light) layer of a tiff file to that of another (reference) tiff tile. This moves all channels of the non-reference image.
How it works
Settings
Parameter |
Default |
Description |
|---|---|---|
Max Size |
10000 px |
Maximum image dimension during processing. Images larger than this are downsampled first to reduce memory usage. |
Number of Tiles |
10 |
How many tiles the image is divided into for alignment. More tiles improves accuracy for images with local deformations but increases processing time quadratically. |
Overlap |
250 px |
Pixel overlap between adjacent tiles. Sufficient overlap ensures seamless stitching of tile alignment results. |
NCC Threshold |
0.85 |
Normalized Cross-Correlation quality threshold per tile. If a tile’s alignment score falls below this value after ORB/SIFT registration, the algorithm falls back to the more expensive B-spline ITK transformation for that tile. Lower values reduce the chance of the ITK fallback being triggered; higher values apply it more aggressively. |
Click Run to perform the alignment, or Cancel to abort.
How it works
The pipeline uses optical flow with ORB (Oriented FAST and Rotated BRIEF) feature detection as the primary method. If ORB cannot find sufficient correspondences (e.g. low-texture regions), SIFT (Scale-Invariant Feature Transform) is used as a fallback.
To handle large images efficiently, the image is divided into overlapping tiles. Each tile is registered independently and the results are composited. The tiled approach accounts for local deformations — such as stage drift or sample distortion — that a single global transform would miss.
Segmentation
The Segmentation sub-tab identifies individual cells in your images. The resulting segmentation masks are used by the View and Analysis tabs to associate pixel intensities with specific cells.
Gaussian Blur (Optional)
A pre-processing blur that reduces high-frequency noise before segmentation. In most cases this is not needed — only apply it if significant noise is causing false detections.
StarDist
StarDist uses a pre-trained convolutional neural network to detect and outline individual cells using star-convex polygon representations.
Select Channel: Choose the image channel to use for cell detection. A channel that clearly shows cell boundaries or nuclei gives the best results.
Use Contrasted Image: When enabled, the segmentation runs on the contrast-adjusted image as set by the toolbar sliders on the canvas, rather than the raw pixel values. Useful when the raw image has poor signal-to-noise and the contrast-adjusted view looks significantly better.
Dilation: Expands each detected cell mask outward by a specified radius after segmentation. Enabled by default (radius = 5 px). Dilation fills gaps between the cell boundary detected by StarDist and the actual cell edge, but does not merge overlapping cells — each cell retains its individual mask.
Basic Parameters (Advanced tab):
Parameter |
Default |
Description |
|---|---|---|
Pre-trained 2D Model |
2D_versatile_fluo |
The StarDist model used for detection. |
Percentile Low |
3.00 |
Lower percentile used for image intensity normalization before segmentation. |
Percentile High |
99.80 |
Upper percentile used for intensity normalization. Decrease if bright artifacts are suppressing cell signal. |
Probability Threshold |
0.48 |
Confidence threshold for accepting a cell detection. Increase to reduce false positives; decrease to capture more cells at the cost of more false positives. |
NMS Threshold |
0.30 |
Maximum allowed IoU overlap between adjacent cell predictions (Non-Maximum Suppression). Lower values are more permissive about overlapping cells. |
Scale Factor (important) |
1.0 |
Rescales the image before passing it to the model. Use |
Number of Tiles |
0 |
Splits the image into tiles for inference, which reduces peak memory usage on large images. |
For a full explanation of the model architecture and parameter tuning guidance, see the StarDist documentation.
CellProfiler-like
An alternative segmentation pipeline suited for larger regions of interest or cell types where StarDist performs poorly. Select CellProfiler-like from the method dropdown in the Segmentation tab.
Use Contrasted Image: Same as StarDist — when enabled, segmentation uses the contrast-adjusted canvas image rather than raw pixel values.
Dilation: Same behavior as StarDist. Enabled by default (radius = 5 px). Expands cell masks without merging overlapping cells.
Invert Image: Inverts pixel intensities before segmentation. Enable this when your image has a bright background and dark cells (e.g. brightfield images), as the pipeline expects dark background and bright foreground by default.
Sample & Test: Lets you draw a small crop of the canvas and run the segmentation pipeline on just that region. Use this to quickly test and tune parameters without waiting for the full image to process.
Save / Load Configuration: Export the current CellProfiler-like settings to a JSON file and reload them in a future session. Useful for reproducibility across datasets.
For a full description of the segmentation parameters, see the CellProfiler IdentifyPrimaryObjects documentation.
Note
A useful starting point: open Advanced Settings, use Sample & Test on a representative region, and iteratively tune the threshold method and smoothing parameters until detections look correct before running on the full image.
Quantification
The Quantification sub-tab extracts per-cell protein intensity values from your segmented images.
Cell Intensity Extraction
For each cell identified by segmentation, the pipeline computes the median fluorescence intensity of each protein channel within the cell mask. User needs to specify a color csv for protein channel for it to be considered.
Output: A CSV file with one row per cell and one column per protein channel, plus spatial metadata (cell centroid coordinates). This file is used as input for the View and Analysis tabs.
How it works
For each segmented cell mask, the pixel intensities of every protein channel are sampled and the median is computed. The cell centroid and bounding box are computed from the mask geometry. The result is a cell × protein expression matrix — the primary data structure used by the View and Analysis tabs.